Data collection
|
Soil sampling was conducted in June 2016 at 36 sites at Ecosystem Management Emulating Natural Disturbance (EMEND) (56° 46' 13'' N, -118° 22' 28'' W), approximately 90 kilometres northwest of Peace River, Alberta. To achieve spatial heterogeneity, sampling was conducted in different compartments across the EMEND landscape (Figure 4). There were four site types (Figure 5). Clearcut stands were harvested in winter 1998, making them 17-years-old at the time of sampling.
At each site a representative tree was selected as a centre point and four sampling areas were marked five metres in each cardinal direction (Figure 6). To sample the rhizosphere, a 20 cm diameter by 10 cm deep core was excavated and forest floor was separated from mineral soil. Forest floor FH (fibric, humic) layers were shaken on a 4 mm sieve to remove bulk soil, and mineral soil was discarded. |

Figure 4. Sampling sites are indicated by yellow pins across the EMEND landscape.
|
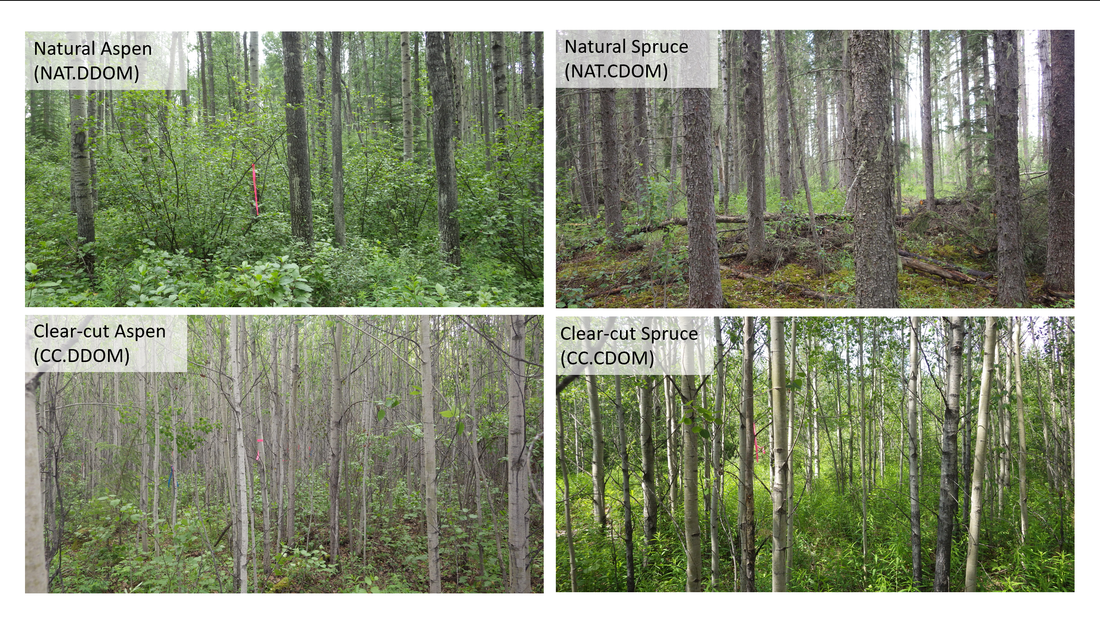
Figure 5. The four site types sampled include: natural deciduous dominated (NAT.DDOM) (n=9), natural coniferous dominated (NAT.CDOM) (n=9), clear-cut deciduous dominated (CC.DDOM) (n=9), and clear-cut coniferous dominated (CC.CDOM) (n=9). Aspen canopies were present in NAT.DDOM, CC.DDOM, and CC.CDOM site types and white spruce canopies were present in the NAT.CDOM treatment.

Figure 6. Schematic diagram of the sampling protocol.
Lab analysis
Figure 7. Structure of a phospholipid fatty acid (PLFA). PLFAs make up the cell membranes of organisms and consist of a polar head with non polar, fatty acid tails. Source: Botany Professor, 2012.
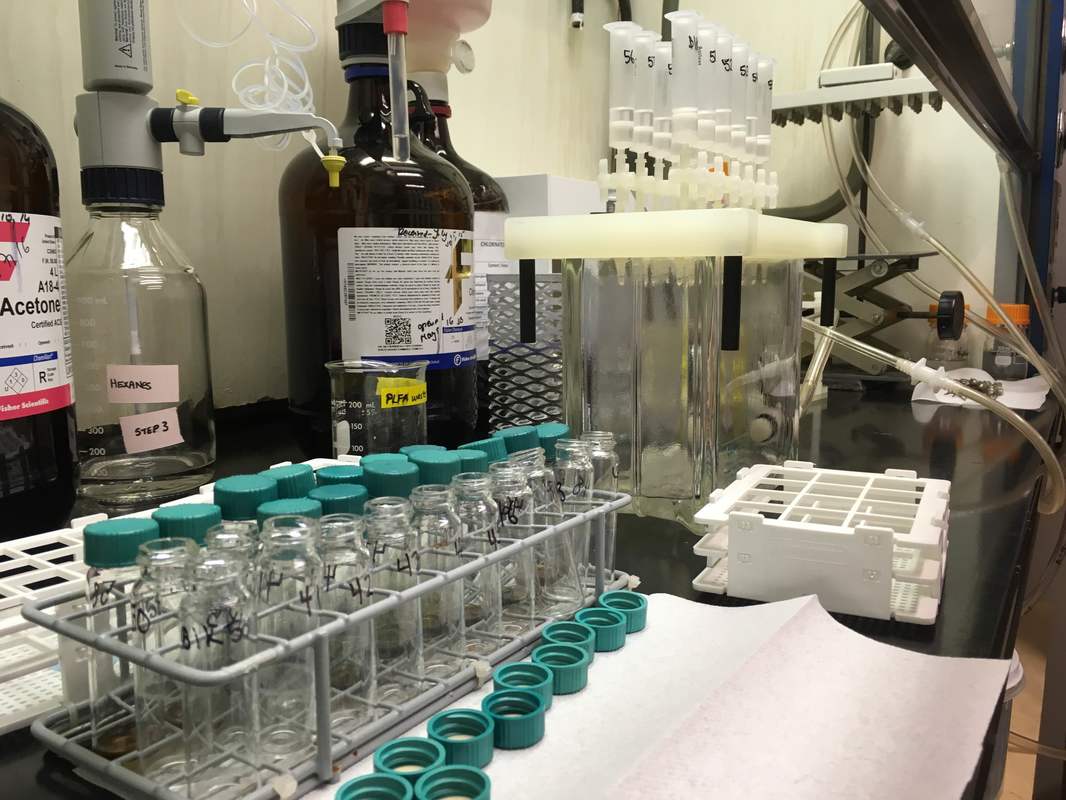
Figure 8. Laboratory set up for phospholipid fatty acid (PLFA) analysis showing the solid phase extraction (SPE) columns.
|
Phospholipid fatty acids (PLFAs) (Figure 7) are used to distinguish specific groups of microorganisms. PLFA analysis was conducted in the Soil Biogeochemistry Lab at the University of Alberta in September and October 2016, following the lab protocol (Quideau et al., 2016). In short, soils were freeze-dried and 0.7 grams of each sample was added to centrifuge tubes. Samples were extracted with Bligh and Dyer extractant (2.0 mL 0.15 M citrate buffer, 2.5 mL chloroform, 5.0 mL methanol) twice. Lipid fractionation was performed using solid phase extraction (SPE) columns (Figure 8). Neutral lipids were eluted with 5 mL of chloroform. Glycolipids were eluted with 5 mL of acetone. Phospholipids were eluted with 5 mL of methanol into centrifuge tubes. Lipid methylation was performed to analyze samples by gas chromatograph (GC). Carbon chains below 14:0 were excluded from analysis.
|
Data analysis
MetaMDS, similar to non-metric multidimensional scaling (NMDS), uses distance matrices to create an ordination to visualize similarities between observations. MetaMDS was used to visualize similarities and differences between site types and rhizopshere versus bulk soil microbial communities. For the ordination, PLFA abundances were square rooted to reduce stress. Log and inverse transformations were also attempted to improve the spread of points, but had little effect on the ordination. Principle coordinate analysis (PCoA)—not shown here—yielded similar results to the MetaMDS.
Permutational analysis of variance (ANOVA) followed by Tukey Honest Significant Differences (HSD) were used to test for significance in the environmental variables due to non-normality. Permutational ANOVA randomizes class variables to generate F-values, as in a standard ANOVA. Permutational multivariate ANOVA (perMANOVA) followed by pairwise perMANOVA was used to test for significance over all PLFAs (the entire microbial community). Microbial community composition was determined by the square rooted nmol(%) of all PLFAs per sample.
Permutational analysis of variance (ANOVA) followed by Tukey Honest Significant Differences (HSD) were used to test for significance in the environmental variables due to non-normality. Permutational ANOVA randomizes class variables to generate F-values, as in a standard ANOVA. Permutational multivariate ANOVA (perMANOVA) followed by pairwise perMANOVA was used to test for significance over all PLFAs (the entire microbial community). Microbial community composition was determined by the square rooted nmol(%) of all PLFAs per sample.
