Results and discussion
Environmental Variables
Permutational ANOVA revealed no significant differences in moisture content across site type. Average pH was significantly higher (p < 0.05) in deciduous dominated stands compared to coniferous dominated stands in both natural and clear-cut sites. Even though the clear-cut spruce stands currently have an aspen canopy, they have low pH like the natural spruce stands. This indicates a legacy effect of spruce on these sites, even 17 years post-harvest.
Using permutational ANOVA, there were no significant differences in leaf area index (LAI) across the four site types (p > 0.05).
Permutational ANOVA indicated no significant differences between total soil carbon and site type (p > 0.05). NAT.CDOM had significantly less total nitrogen (p < 0.01) than other site types and the two clear-cut site types are significantly different.
Multivariate Regression Tree (MRT)
MRT was used to investigate which environmental variables explained the variability within rhizosphere and bulk samples. Moss ground cover explained 18% of the variation in rhizosphere samples (Figure 15); site type, needle cover, and leaf litter cover were alternative predictors that explained as much of the variation as moss. Leaf litter explained 40% of the variation in bulk soil samples (Figure 16). Needles, moss, and site type were alternative predictors that each explained 37% of the variability. It is reasonable that moss, needles, leaf litter, and site type group together as predictors because they relate to whether the overstory is aspen or spruce.
Moss, needles, leaf litter, and site type are better predictors for bulk soil than the rhizosphere. There seems to be some unaccounted for factor that is important for the rhizosphere. When sampling the rhizosphere, collecting standard environmental variables is not enough. Perhaps information on root density or composition of rhizodeposits could better explain variability in the samples.

Figure 15. Multivariate regression tree of environmental variables for rhizosphere samples. The very high CV error indicates that needle cover is not a good predictor for rhizosphere samples.

Figure 16. Multivariate regression tree of environmental variables for bulk soil samples. High CV error indicates that leaf litter is a poor predictor for bulk soil samples.
Total PLFA
Total PLFA is a proxy for microbial biomass. Greater microbial biomass means more potential priming (soil organic matter decomposition). Variability was highest for the rhizopshere in natural stands, as indicated by standard deviation bars (Figure 17). Total PLFA in bulk soil was strongly affected by clear-cutting (Figure 17). Total PLFA was higher in the rhizosphere of natural deciduous and coniferous dominated stands compared to bulk soil, but this was not seen in clear-cut stands. Permutational ANOVA followed by Tukey HSD revealed that rhizosphere total PLFA was significantly higher in natural stands compared to clear-cuts (p < 0.05).
Clear-cutting reduced microbial biomass in the rhizosphere 17 years after harvest, while bulk soil was not significantly affected by clear-cutting. The results indicate the importance of the rhizosphere, and how management decisions can alter this zone of soil. Since total PLFA does not differ in natural stands, vegetation shifts are not likely to affect carbon flux, based only on microbial biomass results. To gain an understanding of the soil system function, microbial community composition has been investigated.

Figure 17. Total PLFA in nmol/g as a result of site type (CC.CDOM = clear-cut, coniferous dominated; CC.DDOM = clear-cut, deciduous dominated; NAT.CDOM = natural, coniferous dominated) and sample type (rhizosphere or bulk soil). Error bars represent one standard deviation from the mean.
Ordination of Microbial Communities
Figure 18 shows that natural spruce stands differed from the other three site types which all have an aspen canopy. While more similar to the DDOM sites, the clear-cut spruce appears to be pulling away towards the natural spruce stands; this makes sense given the legacy effect of spruce, in terms of pH, at clear-cut spruce sites.
Figure 18 also shows that some rhizosphere NAT.CDOM and NAT.DDOM samples have microbial communities that lie outside of the ellipses. Indicator species analysis revealed no indicator species for these outlier sites. Environmental variables, such as moisture and pH, were not significantly different for these sites. The Total PLFA vector indicates that for some of these samples perhaps the difference is not which PLFAs are present, but the proportions of PLFAs present. There may be some unmeasured variable, such as root density or exudation, affecting the proportions of PLFAs.
Not surprisingly, needles and moss were associated with NAT.CDOM sites, while leaf litter was associated with sites that have an aspen canopy. High pH was associated with DDOM stands, which corresponds with pH results above. Total live cover (%) was associated with NAT.CDOM sites and total shrub cover (%) with aspen canopy sites. Total live cover was likely higher in natural spruce stands because of high moss cover. PLFA vectors are explained in "Microbial Groups".
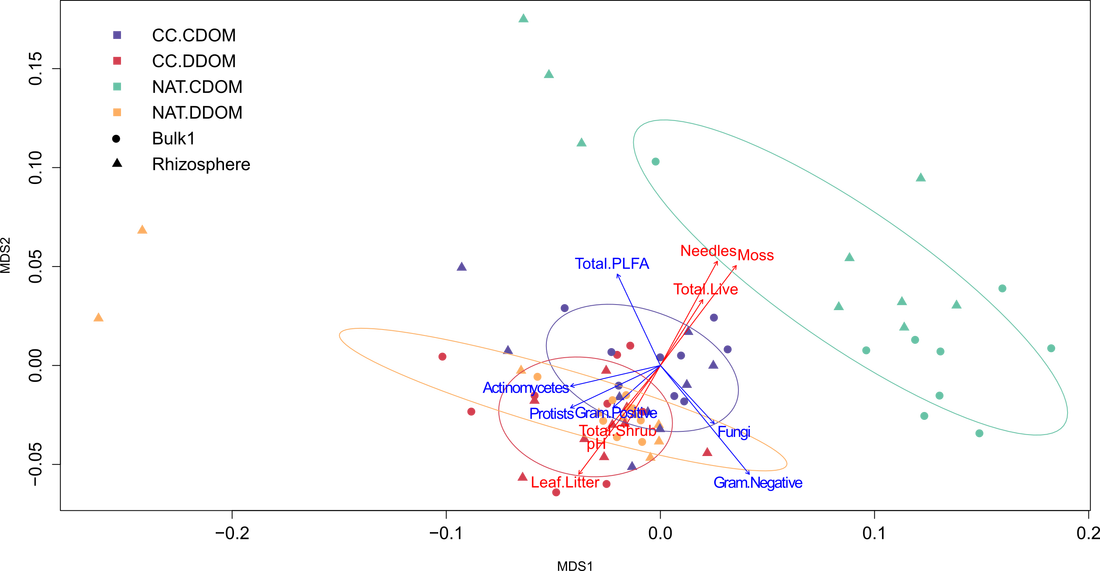
Figure 18. MetaMDS ordination of microbial community composition. Each point represents the microbial community of a specific site, as determined by phospholipid fatty acid (PLFA) analysis. Site types are as follows: CC.CDOM = clear-cut, coniferous dominated; CC.DDOM = clear-cut, deciduous dominated; NAT.CDOM = natural, coniferous dominated; NAT.DDOM = natural, deciduous dominated. Rhizosphere and bulk samples are indicated by different shapes. Red vectors indicate environmental variables and blue vectors indicate PLFA variables. All vectors are significant as determined by the envfit function in R.
Microbial Community Composition
PerMANOVA, followed by pairwise perMANOVA, was used to determine if microbial communities differed significantly depending on two variables: sample type and site type. In the rhizosphere, the NAT.CDOM microbial community was different than the other three site types (p < 0.05); this was expected given the MetaMDS. NAT.DDOM was not different from either clear-cut site type. CC.DDOM and CC.CDOM differed from one another (p < 0.05); like the pH results, this indicates a legacy of spruce on the clear-cut spruce sites. Bulk soil followed the same pattern as rhizosphere communities, except NAT.DDOM differed significantly from CC.DDOM. Clearly a spruce canopy changes the rhizopshere environment; this is likely not caused by pH, given pH is not a factor in the MRT and clear-cut spruce soil pH was similar to natural spruce. This difference must be caused some unmeasured factor, such as rhizodeposits. Different plant species have been shown to release different quality and composition of rhizodeposits (Cheng and Gershenson, 2007). Future work could quantify rhizodeposition rate and composition between aspen and spruce roots.
Clear-cutting significantly affected rhizosphere microbial communities in CDOM stands (NAT.CDOM versus CC.CDOM) (p < 0.05) but not DDOM stands (NAT.DDOM versus CC.DDOM). This contradicts research conducted in the same EMEND compartments four years after clear-cutting (Hannam et al., 2006) (compared to 17 years after clear-cutting in this study). Researchers found no effect of harvesting on microbial communities, likely due to the young age of clear-cut stands.
In the natural stands, microbial community composition did not differ between the rhizosphere and bulk soil. In the clear-cut stands, rhizopshere and bulk soil were significantly different (p < 0.05). Root density may be so high in the natural stands that bulk soil samples actually contained a lot of rhizosphere soil. Yuan and Chen (2012) found that fine root biomass in the forest floor of boreal forests increased with stand age up to 29 years. In the clear-cut stands, assuming root density is lower, bulk soil samples are more likely to not contain rhizosphere soil.
Microbial Groups
Of the 110 PLFAs found across the 72 samples, 33 were identifiable to specific microbial groups. This subset of 33 PLFAs was split into five microbial groups: fungi, gram(-) bacteria, gram(+) bacteria, actinomycetes, and protists. Each microbial group was summed for each sample. Permutational ANOVA revealed differences in site type but no difference in sample type (rhizopshere versus bulk). Differences in microbial groups with site type were investigated within rhizopshere and bulk samples separately (Table 4) using permutational ANOVA followed by Tukey HSD. In the rhizosphere, the only significant differences (p < 0.05) were for protists with more protists in NAT.DDOM stands than NAT.CDOM or CC.DDOM. In the bulk soil, there were significant differences for all microbial groups except fungi (Table 4). Given the microbial groups investigated here, the rhizosphere appears to be provide a more consistent environment across site type, likely because of rhizodeposits.
While natural spruce sites had significantly lower soil nitrogen, potentially meaning microbes are nutrient limited and more likely to degrade soil organic matter (priming), fungi and gram(-) bacteria in the rhizosphere did not differ between natural stands of aspen and spruce. Also considering that total PLFA did not vary in the two site types, changes in rhizosphere carbon flux with vegetation shifts are unlikely.
Microbial groups in rhizosphere versus bulk soil were compared for each site type (Table 6 on Appendix page) using permutational ANOVA followed by Tukey HSD. While microbial groups were more variable within bulk samples, their overall proportions did not differ significantly between the rhizosphere and bulk soil. This analysis only took into account 33 out 110 PLFAs. Statistics based on microbial groups are limited by the lack of information on which PLFAs correspond to which microbial groups.

Table 4. Output from Tukey honest significant differences (HSD) test for microbial groups associated with the four site types. Results for rhizosphere and bulk samples are shown separately.
Indicator Species Analysis (ISA)
ISA was used to determine if PLFAs were associated with specific combinations of site and sample type. Table 5 shows that in the natural stands, the rhizosphere had more indicator PLFAs than the bulk soil. There were no indicators for bulk soil in NAT.DDOM stands. In clear-cut stands, bulk soil had more indicators than the rhizosphere. Two gram(+) PLFAs (14:0 iso and 15:0 anteiso) were indicators for bulk samples in CC.DDOM sites. One fungi and one gram(-) PLFA (18:3 ω6c and 18:1 ω7c) were associated with bulk samples in NAT.CDOM stands. Rhizosphere samples in NAT.DDOM stands had one gram(-) , one gram(+) , two actinomycetes, and one protist indicator (17:1 ω8c, 17:0 iso, 17:0 10 methyl, 18:0 10 methyl, and 20:4 ω6c). The other PLFA indicators could not be associated to microbial groups. With no particular pattern (ie. longer carbon chains or straight chained PLFAs associated with a site or sample type) and not all PLFAs identifiable, information from the ISA is limited. The fact that in general more indicators are associated with natural than clear-cut stands suggests again that clear-cutting affects microbial communities. ISA shows that there are differences in rhizosphere and bulk soil communities depending on site type.
ISA was used to determine if PLFAs were associated with specific combinations of site and sample type. Table 5 shows that in the natural stands, the rhizosphere had more indicator PLFAs than the bulk soil. There were no indicators for bulk soil in NAT.DDOM stands. In clear-cut stands, bulk soil had more indicators than the rhizosphere. Two gram(+) PLFAs (14:0 iso and 15:0 anteiso) were indicators for bulk samples in CC.DDOM sites. One fungi and one gram(-) PLFA (18:3 ω6c and 18:1 ω7c) were associated with bulk samples in NAT.CDOM stands. Rhizosphere samples in NAT.DDOM stands had one gram(-) , one gram(+) , two actinomycetes, and one protist indicator (17:1 ω8c, 17:0 iso, 17:0 10 methyl, 18:0 10 methyl, and 20:4 ω6c). The other PLFA indicators could not be associated to microbial groups. With no particular pattern (ie. longer carbon chains or straight chained PLFAs associated with a site or sample type) and not all PLFAs identifiable, information from the ISA is limited. The fact that in general more indicators are associated with natural than clear-cut stands suggests again that clear-cutting affects microbial communities. ISA shows that there are differences in rhizosphere and bulk soil communities depending on site type.

Table 5. Indicator species analysis performed on PLFAs for the four site types and two sample types. The Duleg function was true in order to only compare differences between groups. Bolded PLFAs indicate those that can be associated to a specific microbial group. Site types are as follows: CC.CDOM = clear-cut, coniferous dominated; CC.DDOM = clear-cut, deciduous dominated; NAT.CDOM = natural, coniferous dominated; NAT.DDOM = natural, deciduous dominated.
